A story about story points
The traditionalists want to stone me, when I say 'all estimates are wrong'. I face those stones with conviction, because in the project management world, no project got over within the initially estimated time, cost and scope. Most of the leading project management software packages institutionalized this by providing the multiple baseline feature :-). Under these premises, when the agile enthusiast within me puts his feet down and say with conviction that 'all estimates are wrong, so do not strive for too much accuracy while estimating the features', I expect you to listen to understand.
In the agile world, 'Story' is the description of the feature to be done, and the weight given to it based on the work involved to implement it is known as 'story point'. Higher the number, higher the work involved. In order to simplify this process we use the fibonacci series of 0, 1, 2,3,5, 8, 13. Since there is a gap between the numbers, it becomes easier to do the classification than using a continuous series like 0, 1, 2, 3, 4,5, 6, 7, 8….. We are looking for patterns not for accuracy. Somewhere in the net, someone has written about 'T' shirt sizing into small, medium, large. I came across another analogy of making fruit salad. To make fruit salad, you estimated 10 apples and 10 oranges. You are not worried about big oranges or small oranges. The shop had 20 apples and 5 oranges and two jack fruits. You are sure that you cannot replace an orange with a jack fruit. So, you bought 15 apples and 5 oranges. So, we must know whether the feature under consideration is an apple, orange or jack fruit. That is the kind of accuracy we are looking at.
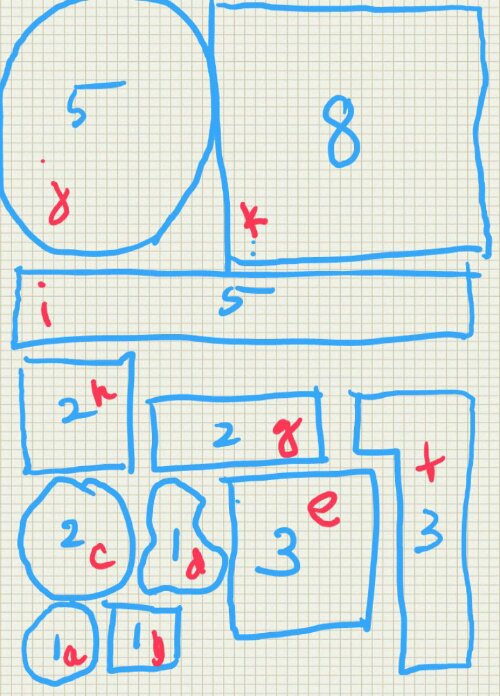
In the diagram below let us assume that each shape is a feature to be developed and we have given them a number based on the fibonacci series, the smallest of the lot getting 1. That means each feature under consideration gets a weight based on the amount of work involved to accomplish it. A small yet complex component will get a higher weight. Similarly a very large, yet simple feature may get the same weight, and sometimes even lesser. So, it is safer to say that the weight is given based on the amount of work involved in completing the feature.
Let us assume that the diagram above contains features 'A' to 'K'. ‘A’ is the smallest, so I gave it a 1. ‘B’ is the next bigger one. Is it double the size of ‘a’, no, so I gave it 1. ‘C’ and ‘D’ are bigger than a and b and are almost double the size of a and b, so I gave them a weigh of 2. E and F are bigger than c and d so I gave them 3…likewise based on analogy I gave weigh for all features under consideration. Here we are not looking for too much accuracy. We are looking for patterns. It is as simple as grouping the features based on the work involved to accomplish them. For ease, we use fibonacci series for the grouping.
How the estimation is done in real life by playing poker will be explained in my next post. Hope this post brings in some more clarity about story points which is the most misunderstood in agile circles because they are very simple. At least I took lot of time to understand it, because I was expecting something very profound under the term 'Story point'.


Comments
Post a Comment